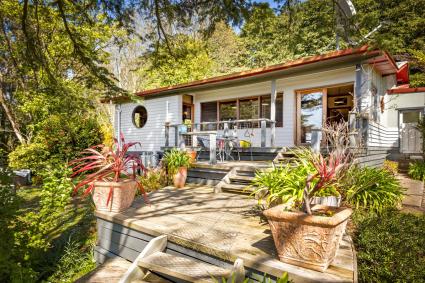
30 Peddles Road, Trida, VIC, 3953
2
1
2
Land size: 9282 sqm
Sold prices:
| Oct 2019 | $387,000 |
| Mar 2014 | $196,000 |
| Feb 2006 | $272,000 |
| Mar 1997 | $65,000 |
| Feb 1990 | $79,500 |
| Jan 1987 | $55,000 |
Free statistics by SQM Resarch for postcode 3953:
Research Reports
- SQM Property Explorer
- Postcode Snapshot
- Boom and Bust Report
- Distressed Properties
- Top 60 Postcode Performance
Free Property Data
- Upcoming Auctions
- Sold Records
- Total Property Listings
- Asking Property Prices
- Vacancy Rates
- Weekly Rent Listings
- Rental Yields
- Asking Rent Prices
- Demographics