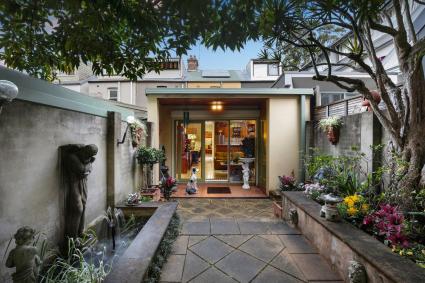
Jan 2019 | $1,400,000 |
18/Jan/2019 | For sale | Under Contract | link |
30/Nov/2018 | For sale | For Sale $1,650,000 | link |
12/Oct/2018 | For sale | Auction | link |
4/May/2018 | For sale | Contact Agent Auction Sat 12 M | link |
27/Apr/2018 | For sale | Auction | link |
Below you will find a price per sqm scatterplot chart of sold properties for the postcode 2042. This chart reveals the relationship between sold prices verses land size. Feel free to click on/hover over the particular dot points as they will highlight the property for that sale. You are also able to compare the relationship by clicking on previous years as offered below the chart. A "best fit" curve represents the relative relationship between the sold price and landsize. We call this the Price Per SQM Co-Efficient Curve™ A regional comparison is provided by the purple curve.
SQM Research Ratings Update - March 2019
SQM Research Weekly Residential Newsletter 19 February 2019
SQM Research Weekly Residential Newsletter 12 February 2019
SQM Research Weekly Residential Newsletter 5 February 2019
SQM Research Weekly Residential Newsletter 29 January 2019